Metrics for enterprise components
The enterprise Kubernetes components expose operational and usage metrics at the standard /metrics path on each controller's HTTP port.
Use Prometheus to collect these metrics and Grafana to visualize them. Monitor for conditions that indicate performance issues or security concerns.
The metrics are exposed by the following components:
- Approver Policy
- cert-manager
- CSI Driver
- CSI Driver for SPIFFE
- Discovery Agent for Next-Gen Trust Security
- Distributed Issuer
- Enterprise Issuer for Next-Gen Trust Security
- Istio CSR
- Trust Manager
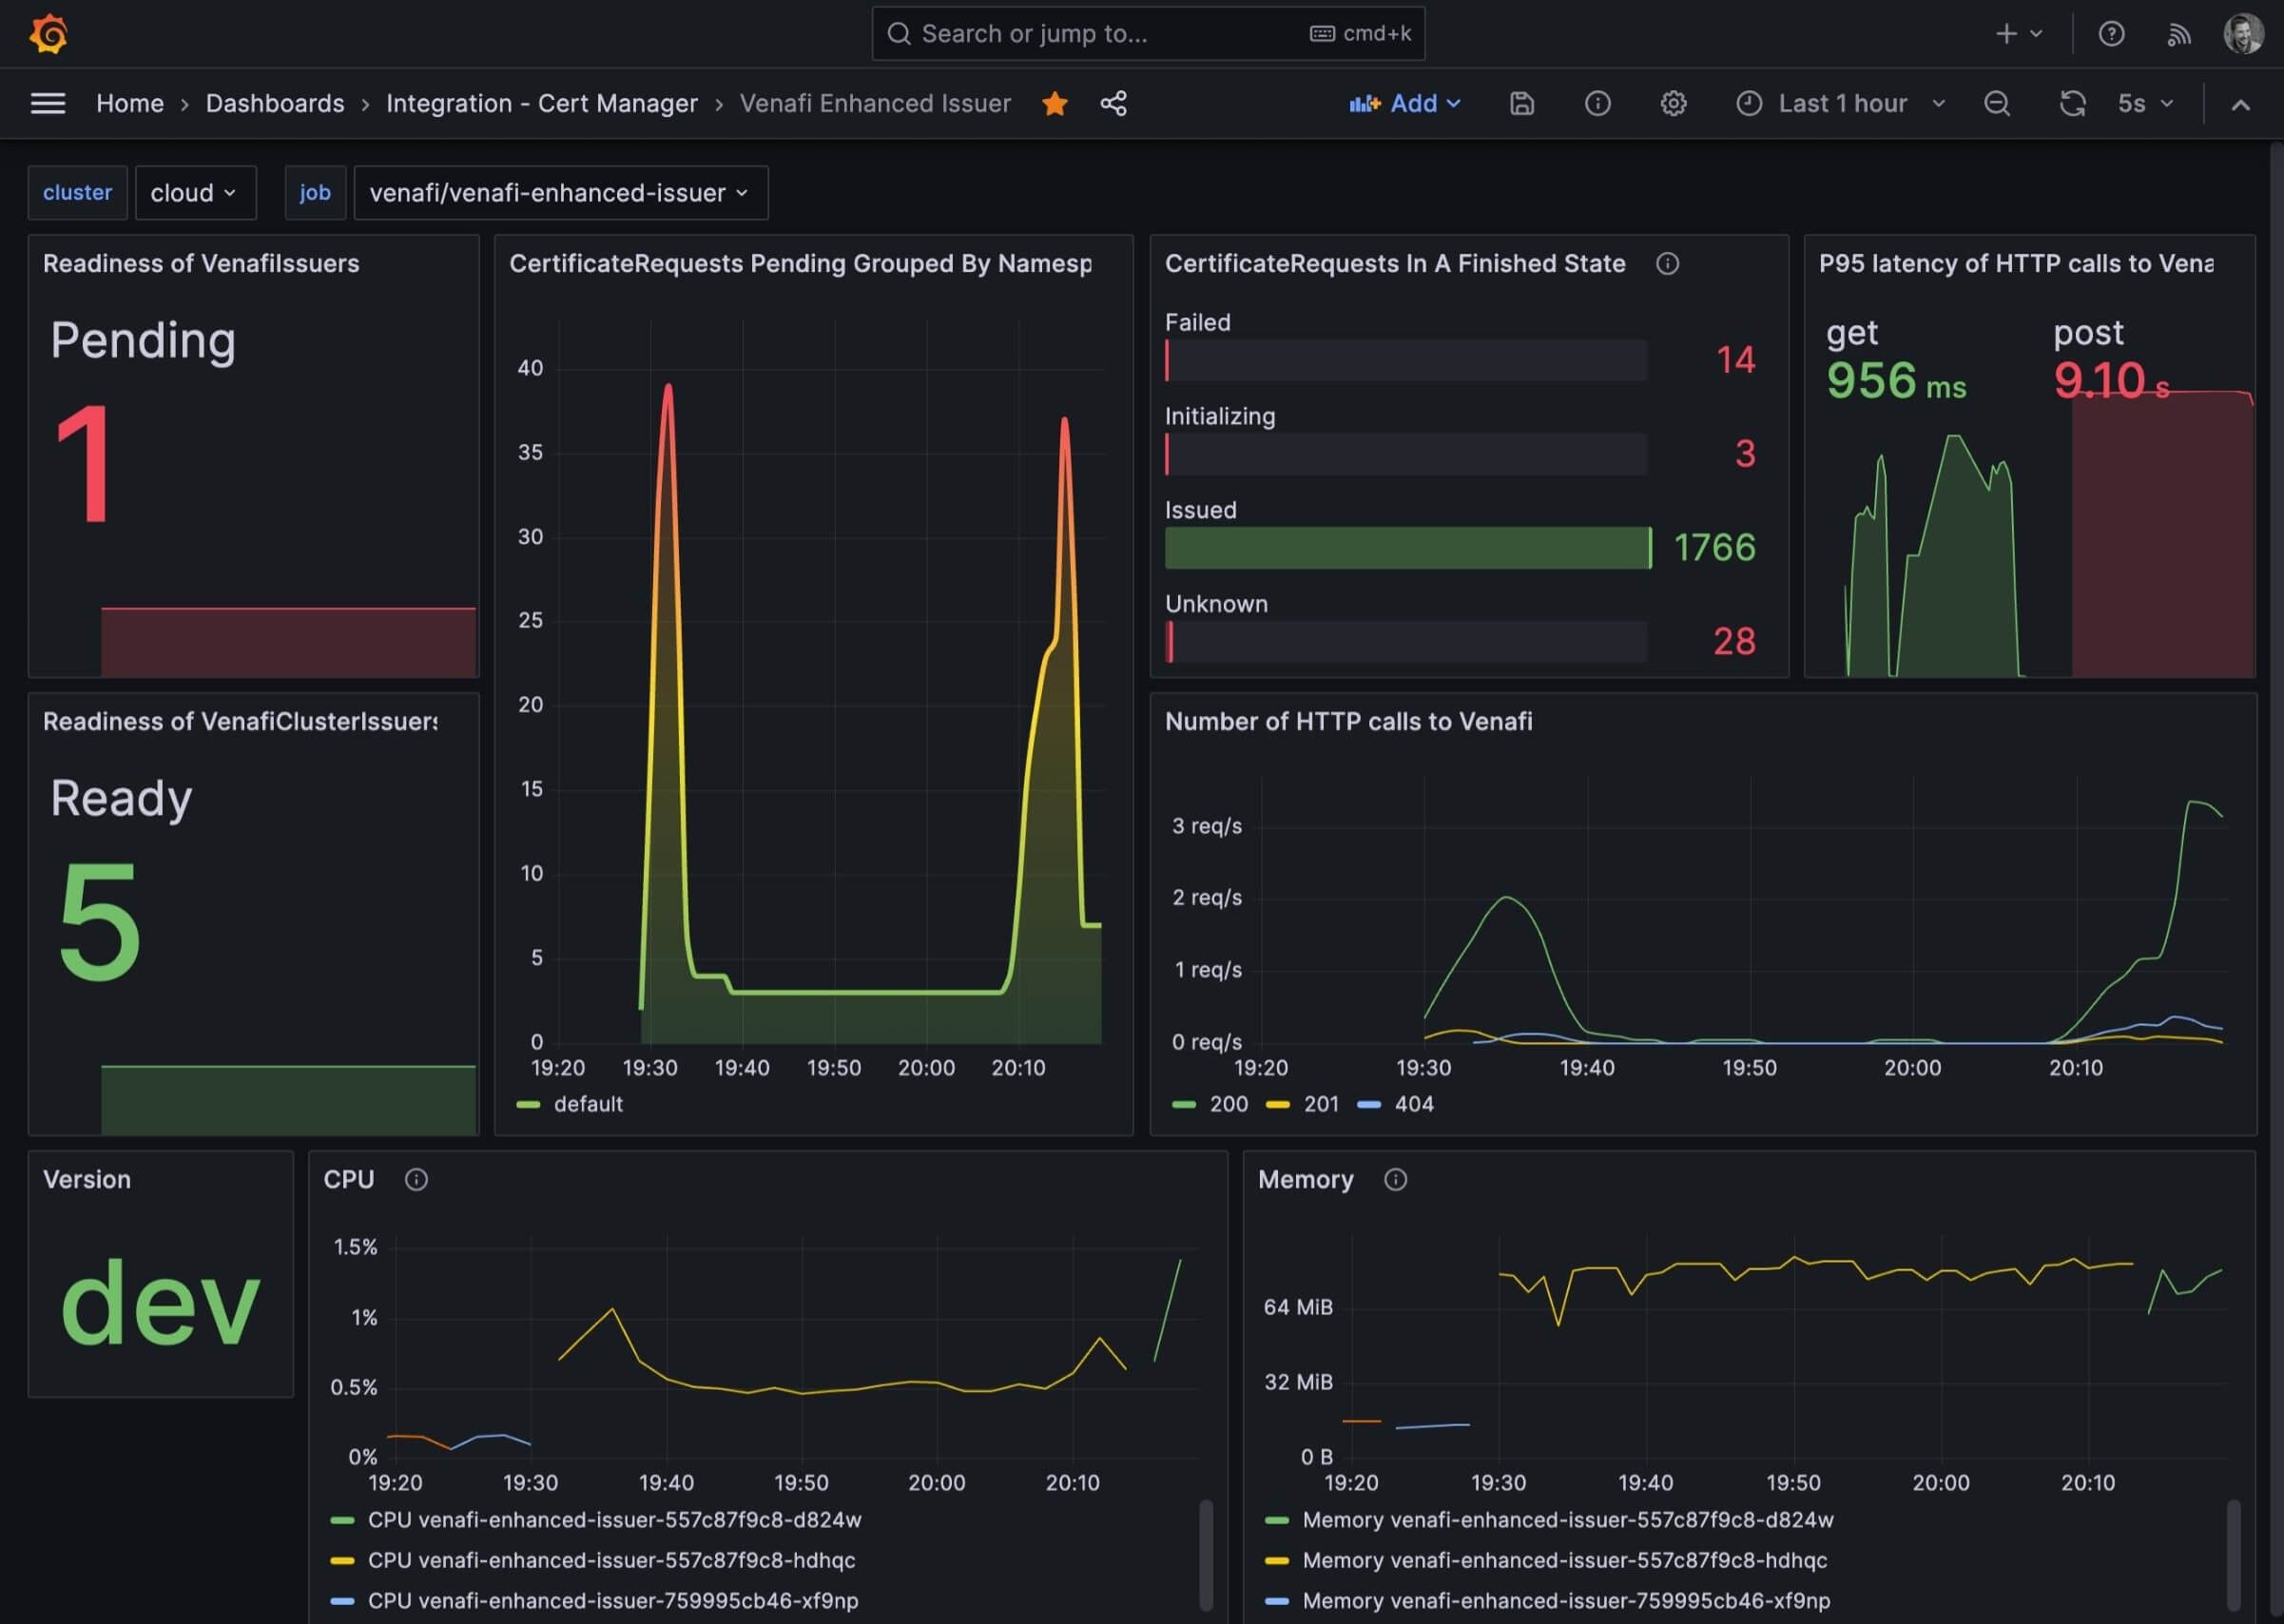
The following image shows an example of a Grafana dashboard for Enterprise Issuer for Next-Gen Trust Security: